The EUR/USD currency pair continued moving lower on Monday. In fact, over the past months, you could start 80% of articles with this sentence, because the European currency does nothing
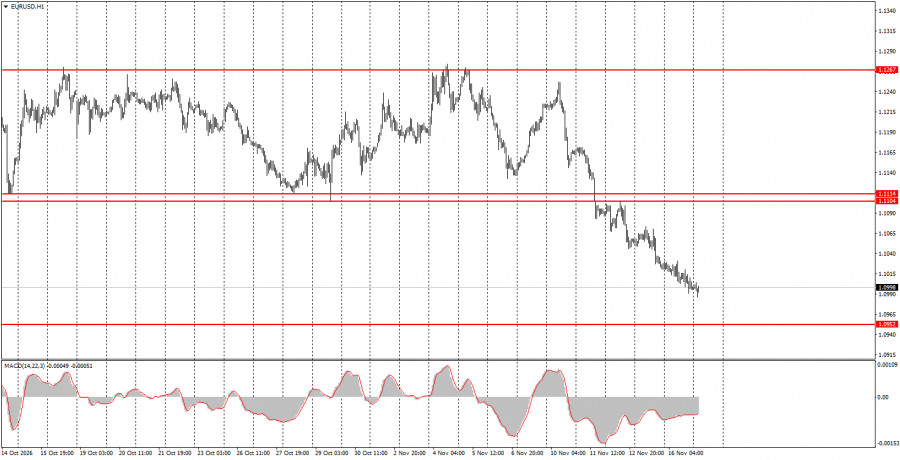
The EUR/USD currency pair continued moving lower on Monday. In fact, over the past months, you could start 80% of articles with this sentence, because the European currency does nothing but fall with almost no meaningful corrections. We have repeatedly noted that this pattern of movement is itself illogical and speculative, and the fundamental and macroeconomic backdrop does not justify a constant decline of the euro. Yet the market constantly finds new formal reasons to sell the euro and buy the dollar. For example, yesterday the eurozone industrial production report was weaker than expected. Isn't that a reason to continue selling the euro? This is exactly our point: if industrial production falls, the euro can and should be sold. If the economy grows or the European Central Bank raises rates, you can ignore that factor. The market continues to pick the factors that support the dollar and only reacts to them.
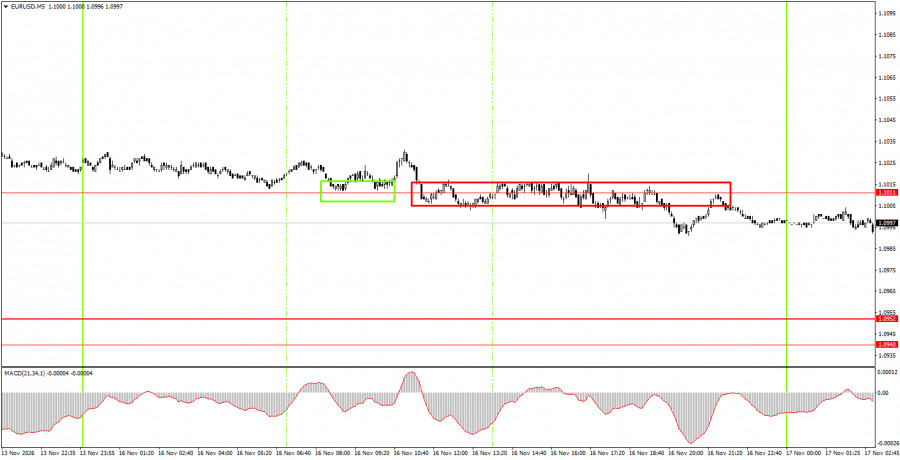
On the 5-minute TF, two trading signals formed on Monday, but intraday moves were very weak and nearly flat. First, the pair rebounded from the 1.1011 level but failed to develop an upward move. Then 1.1011 was breached, and we now have more confidence in continued decline. Target — the 1.0940–1.0952 area.
On the hourly timeframe, the EUR/USD pair has resumed forming a downward trend. The euro has not been able to correct properly in recent weeks. Considering all events over the past months, we do not believe the euro had grounds for such a sharp drop with virtually no correction. At the moment, the dollar is heavily overbought, and many factors in favor of the euro are being ignored.
On Tuesday, novice traders may remain in short positions after consolidation below 1.1011, targeting 1.0940–1.0952. Open long positions if price consolidates above 1.1011, targeting 1.1104–1.1114.
On the 5-minute TF consider the levels 1.0888–1.0896, 1.0940–1.0952, 1.1011, 1.1104–1.1114, 1.1198–1.1218, 1.1267–1.1275, 1.1366–1.1377, 1.1461–1.1474. On Tuesday, Germany and the EU will publish ZEW economic sentiment indices, and the US will release retail sales and industrial production reports. In principle, any of these releases could trigger new US dollar strength.
Price levels (areas) of support and resistance — levels that serve as targets when opening longs or shorts or as sources of signals.
Red lines — channels or trendlines that display the current trend and indicate the preferred trading direction.
MACD indicator (14,22,3) — histogram and signal line — an auxiliary indicator that can also be used as a source of signals.
Important speeches and reports (listed in the news calendar) can strongly affect a currency pair's movement. Therefore, when they are released, one should trade as cautiously as possible or step aside to avoid a sudden price reversal against the prior direction.
Beginner forex traders should remember that not every trade can be profitable. Developing a clear strategy and money-management rules is the key to long-term success in trading.

QUICK LINKS
ForexMart is authorized and regulated in various jurisdictions.
(Reg No.23071, IBC 2015) with a registered office at First Floor, SVG Teachers Co-operative Credit Union Limited Uptown Building, Corner of James and Middle Street, Kingstown, Saint Vincent and the Grenadines
Restricted Regions: the United States of America, North Korea, Sudan, Syria and some other regions.


 Contact Us